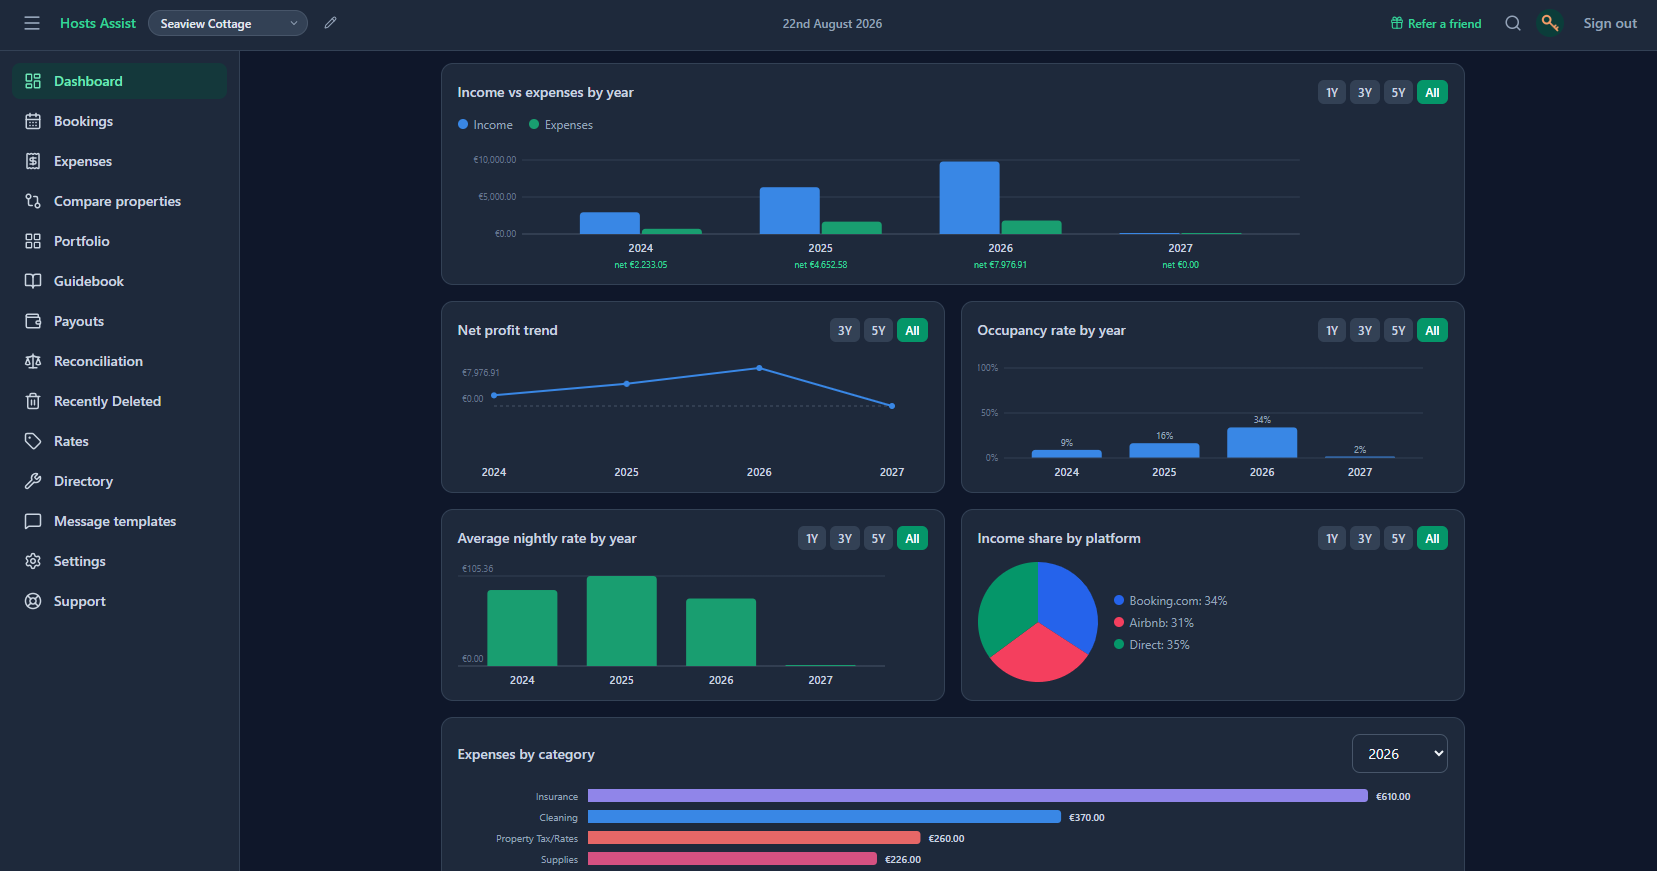
Two numbers, tracked together, explain almost everything about how a short-term rental is actually performing: occupancy rate (the share of available nights that were booked) and average nightly rate (what those booked nights actually paid, on average). Tracked separately, either one on its own can be quietly misleading.
What each one actually measures
Occupancy rate is booked nights divided by available nights, over whatever period you're looking at. A property booked 20 nights out of a 30-night month is at roughly 67% occupancy. It says nothing about what those nights were worth, only how full the calendar was.
Average nightly rate is total booking income divided by nights booked. It says nothing about how many nights were actually sold, only what the ones that were sold paid on average.
Neither number, alone, tells you whether a property is doing well. A property can hit 95% occupancy at a rate so low it barely covers costs, and a property can sit at 40% occupancy with a nightly rate high enough to still come out ahead.
Why pushing one tends to move the other
These two numbers usually trade against each other, not by accident but by how pricing works: drop the nightly rate and more guests book, pushing occupancy up; raise it and fewer do, pushing occupancy down.
Chasing one number in isolation is how a host ends up either fully booked at a rate that isn't really worth it, or holding out for a high rate that rarely gets taken.
The number that actually matters: revenue per available night
Multiplying occupancy by average nightly rate gives a single figure, often called RevPAN (revenue per available night), that captures both at once. Two very different combinations, say 90% occupancy at €90 a night, or 60% occupancy at €135 a night, can land on almost exactly the same result. Comparing periods, or comparing properties, on this combined figure avoids the trap of assuming higher occupancy alone means a better outcome.
Compare like periods, not the raw numbers
Occupancy is highly seasonal for most short-term rentals, so a plain month-to-month comparison mostly measures the season, not performance. Comparing the same month against last year, or comparing occupancy against the local average for that time of year, gives a far more honest read on whether pricing or marketing is actually working.
Where this stops being abstract
The practical use of tracking both is almost always a pricing decision: is a quiet month better addressed with a lower rate to fill more nights, or is demand there anyway and only the rate needs to move? Without both numbers in view side by side, that's a guess. With them, it's a reasonably confident call.
How this works in Hosts Assist: occupancy and average nightly rate are already worked out on the dashboard for every property, alongside a rates calculator for pricing out a stay before it's booked — no separate spreadsheet formula to build or maintain.
If you manage more than one property
The same two numbers, compared side by side across properties, usually explain any gap between them faster than anything else: one property quietly under-priced relative to demand, another priced right but under-marketed. Without a combined view, that gap tends to just look like "property A does better," with no clear reason why.